
Mastering the grouping feature in Excel can greatly help you organize your spreadsheets more efficiently. Whether you're dealing with complicated data or simply wanting to simplify your view, learning how to group and ungroup columns is important. I have some quick tips that will help you streamline your workflow and make your data more manageable. Let's dive into the easy steps to group and ungroup columns, so you can get the most out of your Excel experience.
Why Group and Ungroup Columns in Excel?
Create a More Organized Spreadsheet
When you're dealing with complex datasets, you often find yourself facing a confusing array of columns that can make any analysis feel overwhelming. But don't worry, I'm here to help!
Excel's grouping feature is like a superhero that saves the day. It lets you organize related data into neat sections, making your spreadsheets much easier to read and understand.
For example, if you're working on a financial report, you can group all the columns related to revenue together. This makes it super simple for anyone reviewing the document to quickly grasp the financial structure. It's not just about making things look good; it's about creating a logical flow of information that enhances the overall user experience.
Simplify Data Analysis
Grouping columns is really useful when you're analyzing data, like sales data. Let's say you want to compare the performance of different quarters. By grouping the columns by quarter, you can easily compare how well Q1 did compared to Q2 with just a click, instead of having to scroll through a lot of rows and columns. But it's not just about comparing time periods.
When you group your data, you can also apply functions and formulas to a specific segment of your dataset without affecting the rest of the data.
For example, you can use a SUM function to add up the values in just one group, which can be a real game-changer. And if you need to, you can always ungroup the data to see the details and do more in-depth analysis. This dual functionality is really helpful when you want to switch between seeing summaries and looking at the finer details, so you can quickly find meaningful insights.
How to Group Columns in Excel
Step 1: Select the Columns to Group
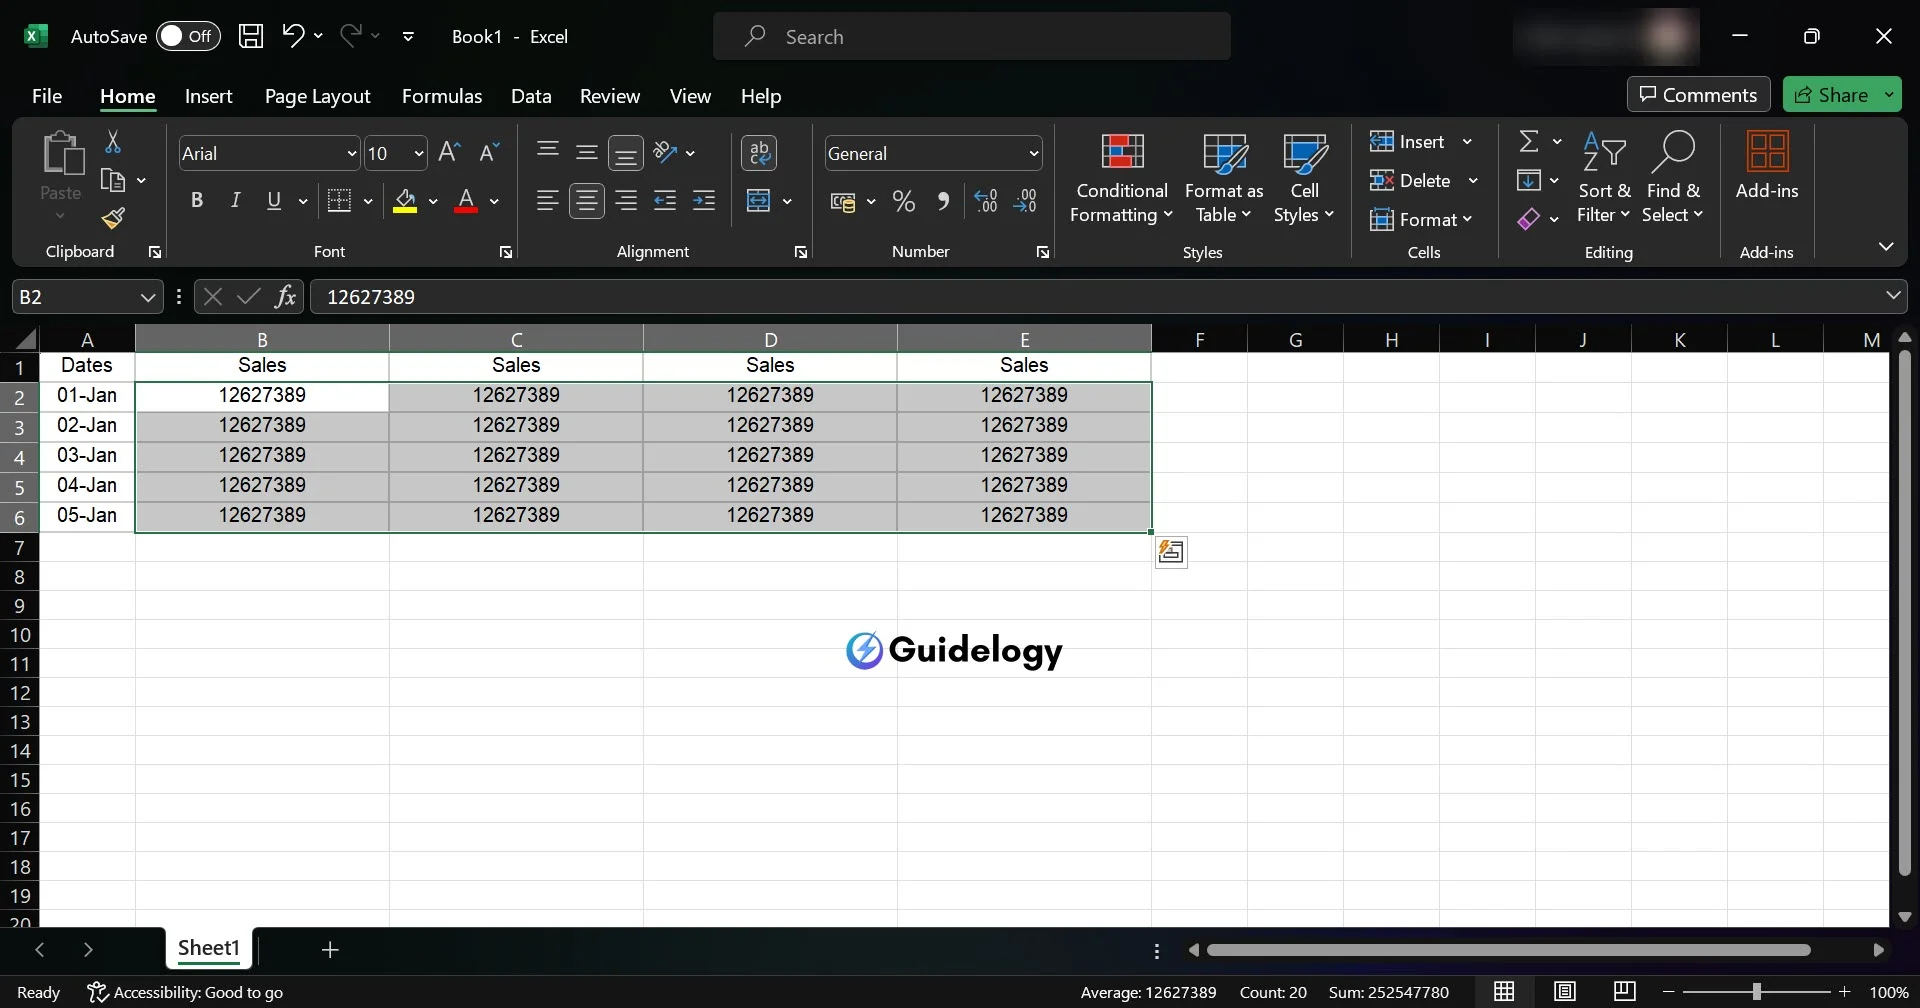
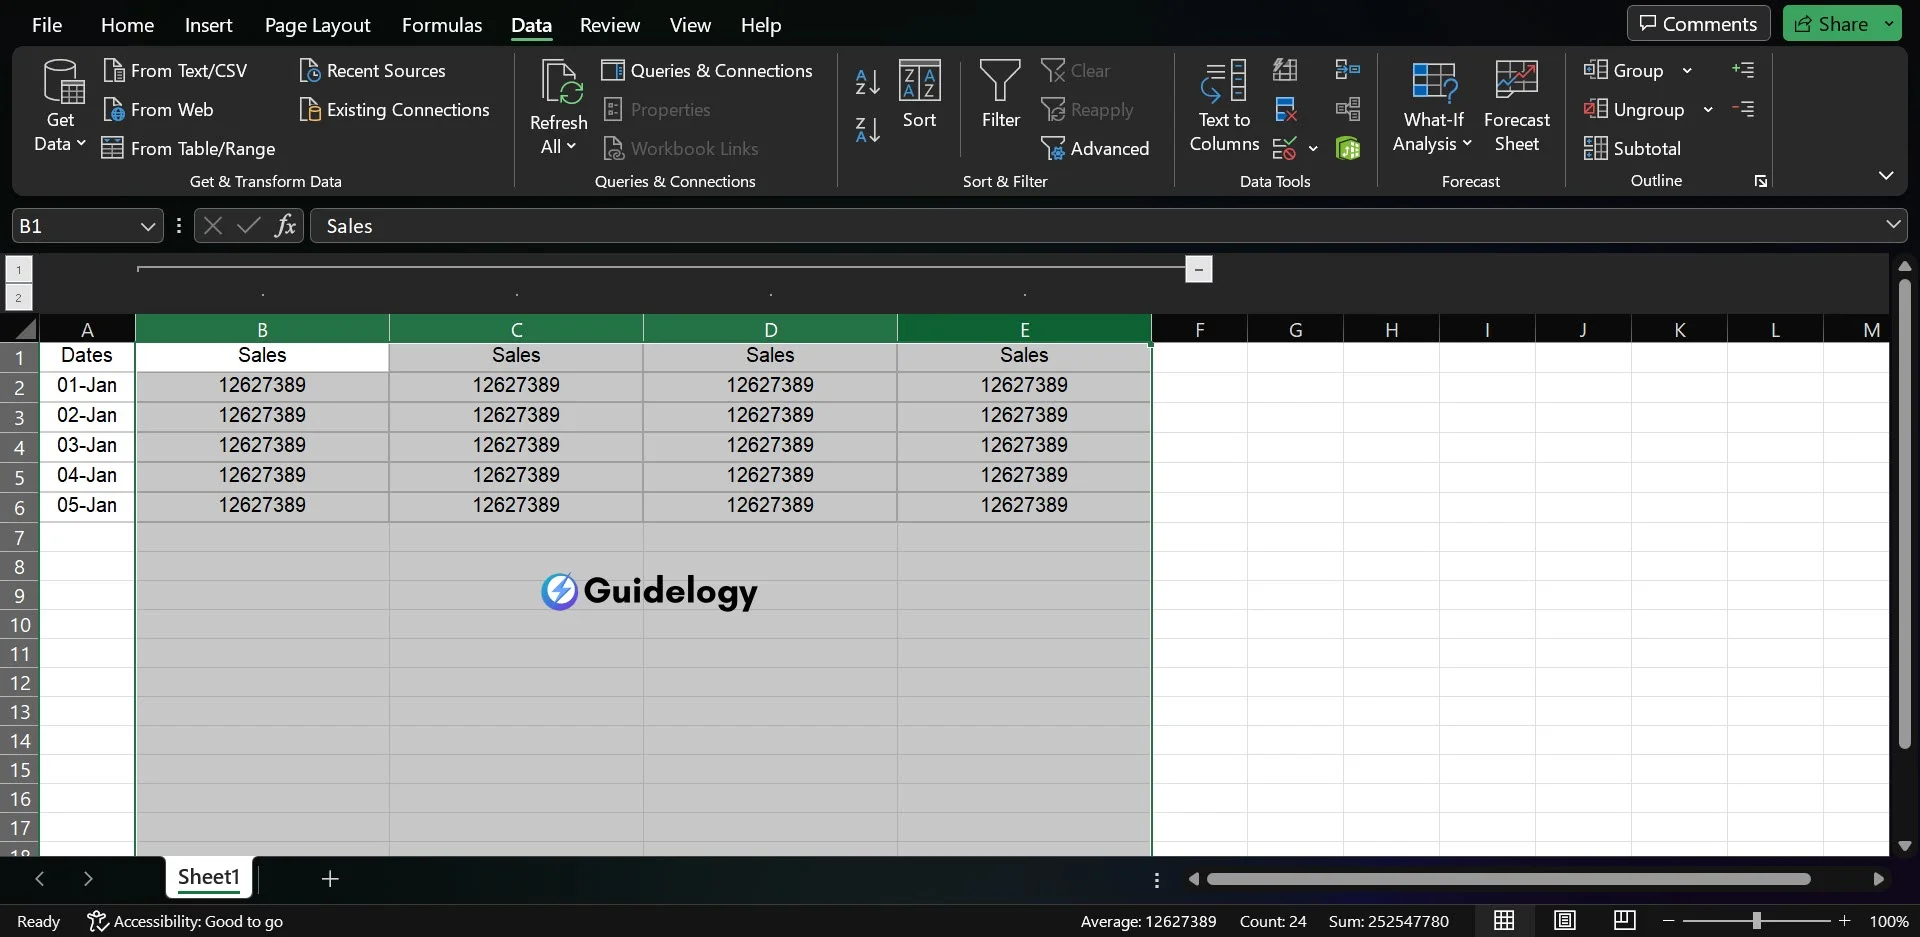
When you work with a big set of data, you may find that grouping columns can greatly improve your workflow. To group columns in Excel, start by selecting the range of columns that are next to each other and need to be grouped together. This will help you organize your data more effectively and make it easier for you to analyze and manipulate it.
For example, If you want to summarize your sales data for better comparison, you can do it easily in Excel. Just click on the header of the first column, let's say “Column B,” and drag your mouse across to the last column in the range, which could be “Column E.” By doing this, you are telling Excel which columns you want to group together.
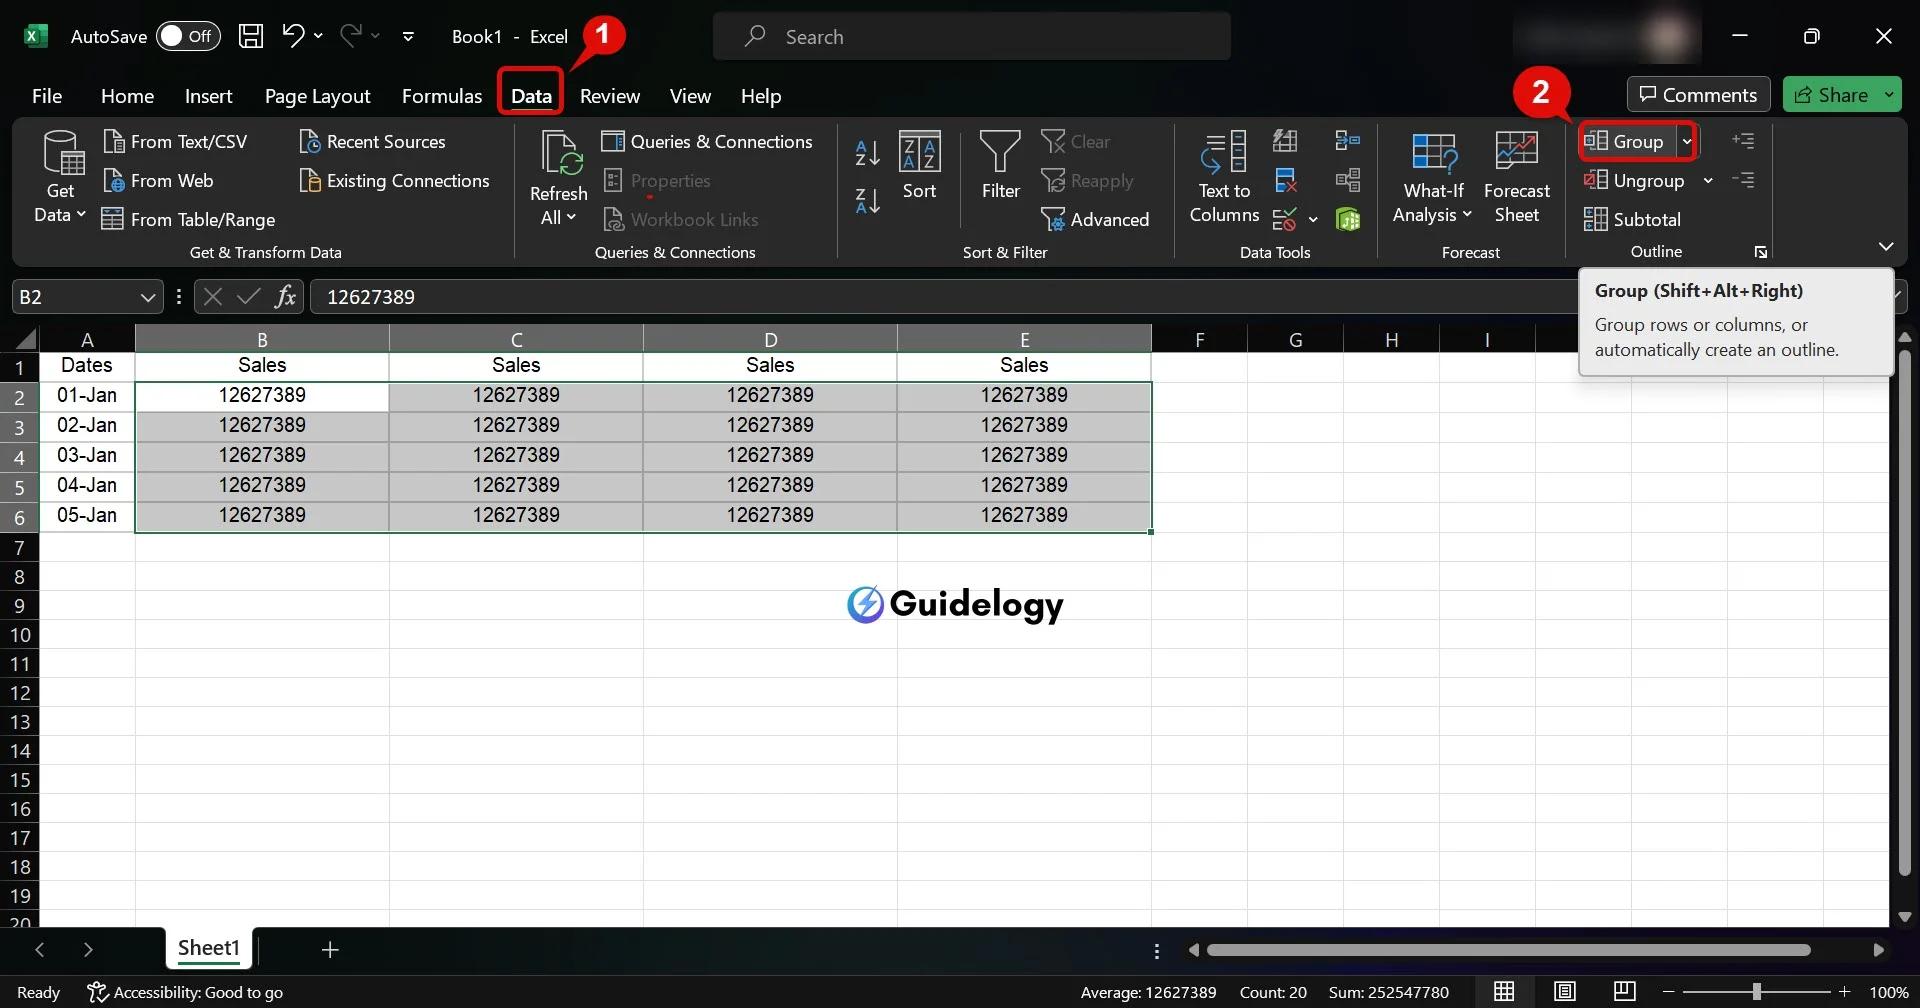
Step 2: Click on “Data” & “Group”
Once you have selected your columns, go to the “Data” tab on the Excel ribbon. This tab has tools for managing your data, and you will find the “Group” command here. When you are working with Excel, it's important to switch between different data views efficiently, so knowing where to find this command quickly is crucial. By clicking on “Group,” you can easily condense the selected columns into a single group.
Step 3: Select “Column” and Proceed
Once you click on “Group,” a small box will pop up with options to group your rows or columns. Since your goal is to organize your columns, you can select the “Columns” option. After selecting it, click ‘OK,' and Excel will instantly group your chosen columns together.
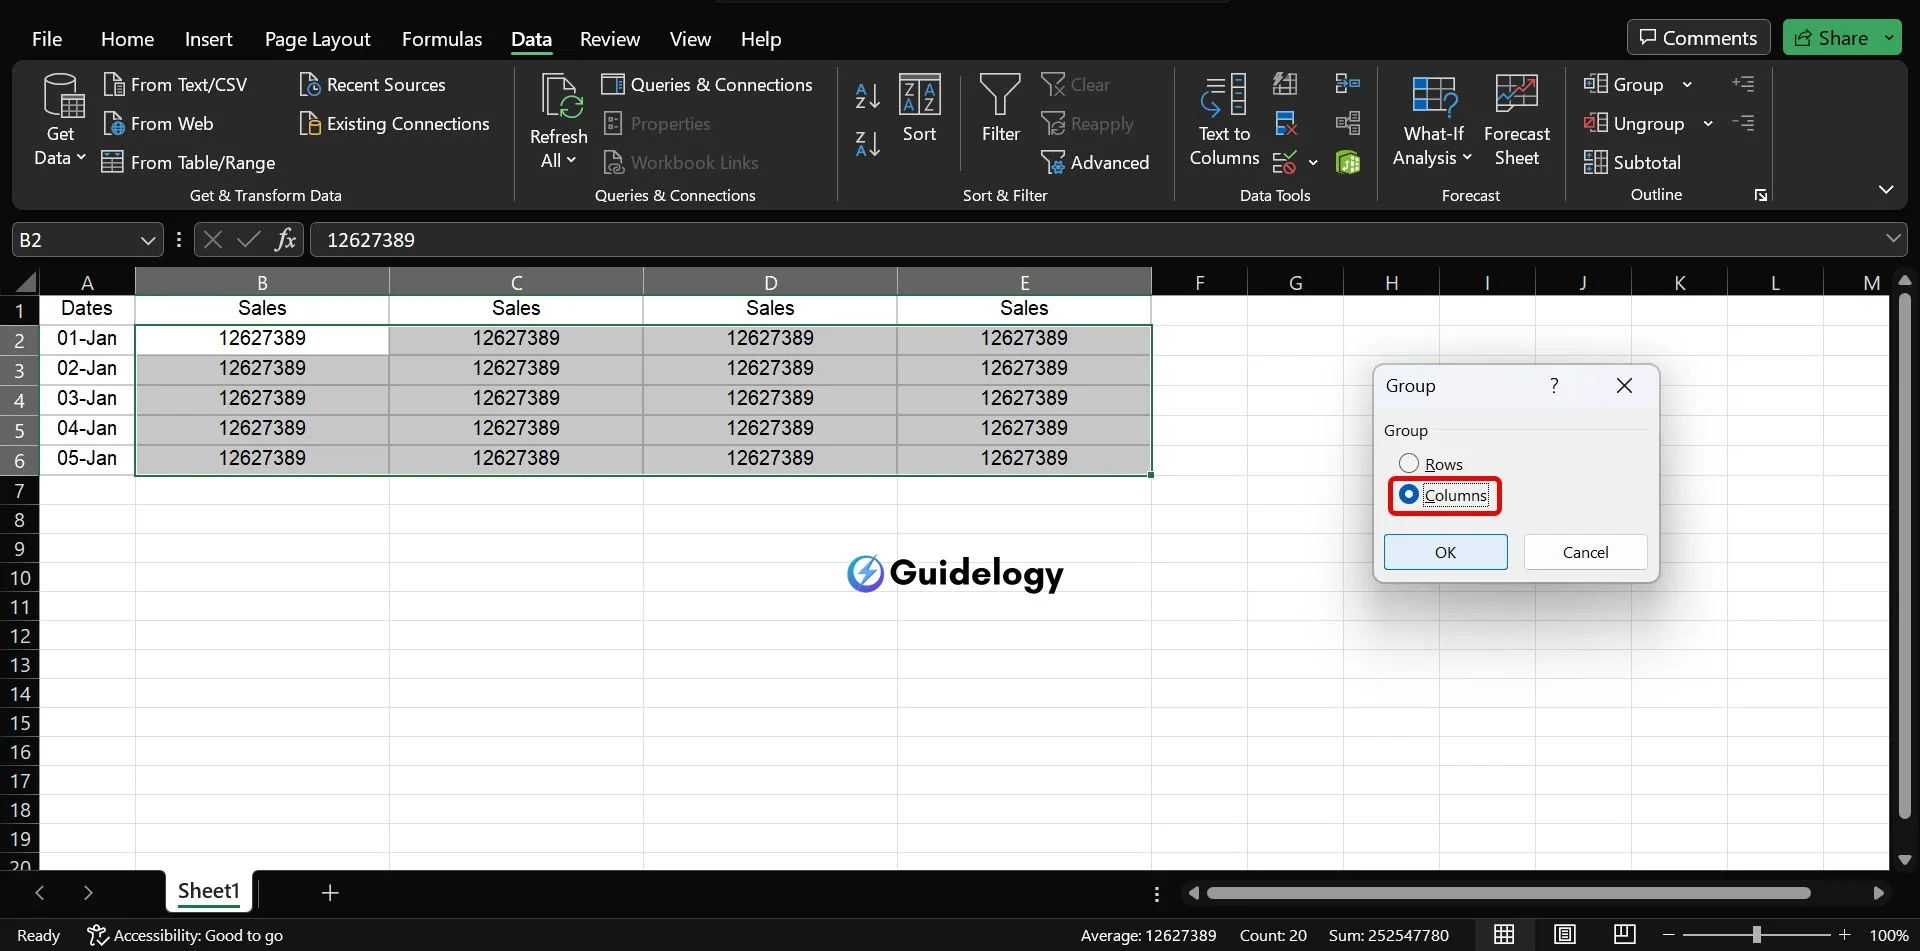
You will notice a small icon appearing on the left side of the grouped columns, which allows you to easily collapse or expand the group with just a click. This feature comes in handy when you're analyzing yearly data and need to focus on specific quarters without getting distracted by other data points.
By following these steps, you can keep your Excel sheets clean and focus on the information that's most relevant to my assessment. Grouping columns not only enhances readability but also enables to navigate large sets of data with more agility.
How to Ungroup Columns in Excel
Step 1: Select the Grouped Columns
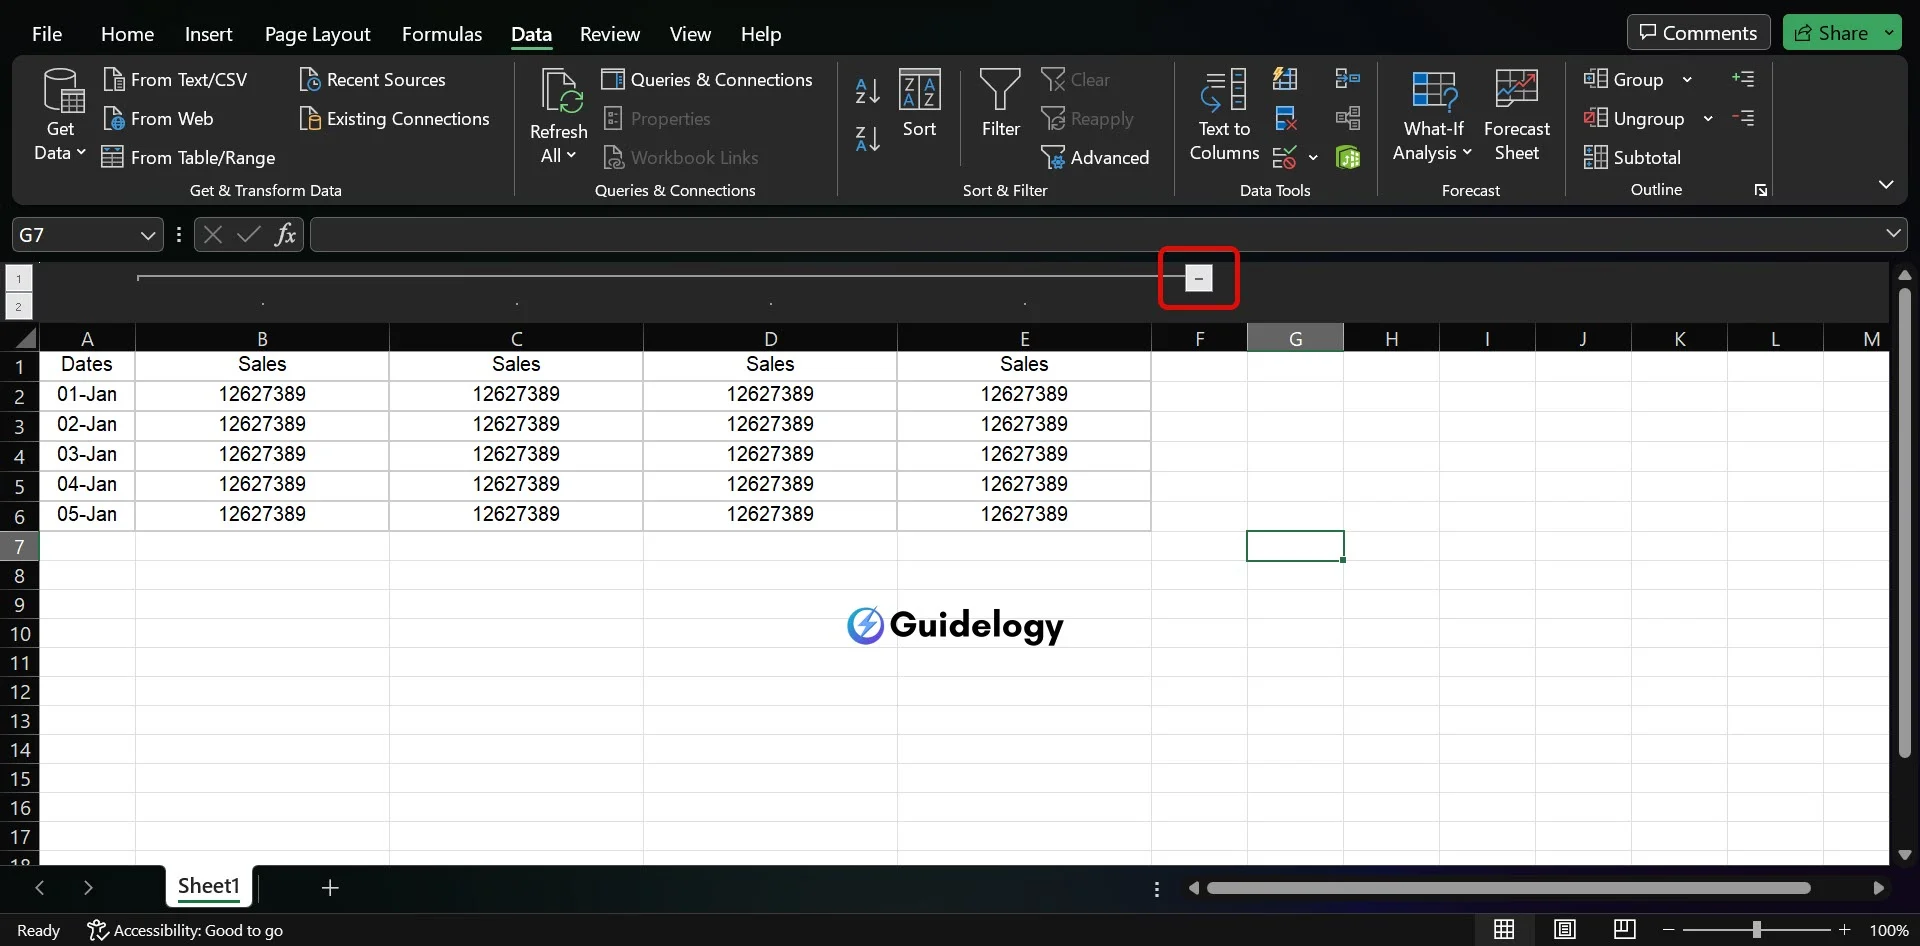
To start ungrouping, you need to find and choose the grouped columns in your Excel sheet. It's similar to selecting any range of cells, but there's a trick: look for the bar above your worksheet that shows outlines. This bar tells you where the groups are. You can ungroup specific columns by clicking on the minus (-) symbols on this bar. Make sure you select the entire set of grouped columns to avoid only partially ungrouping them.
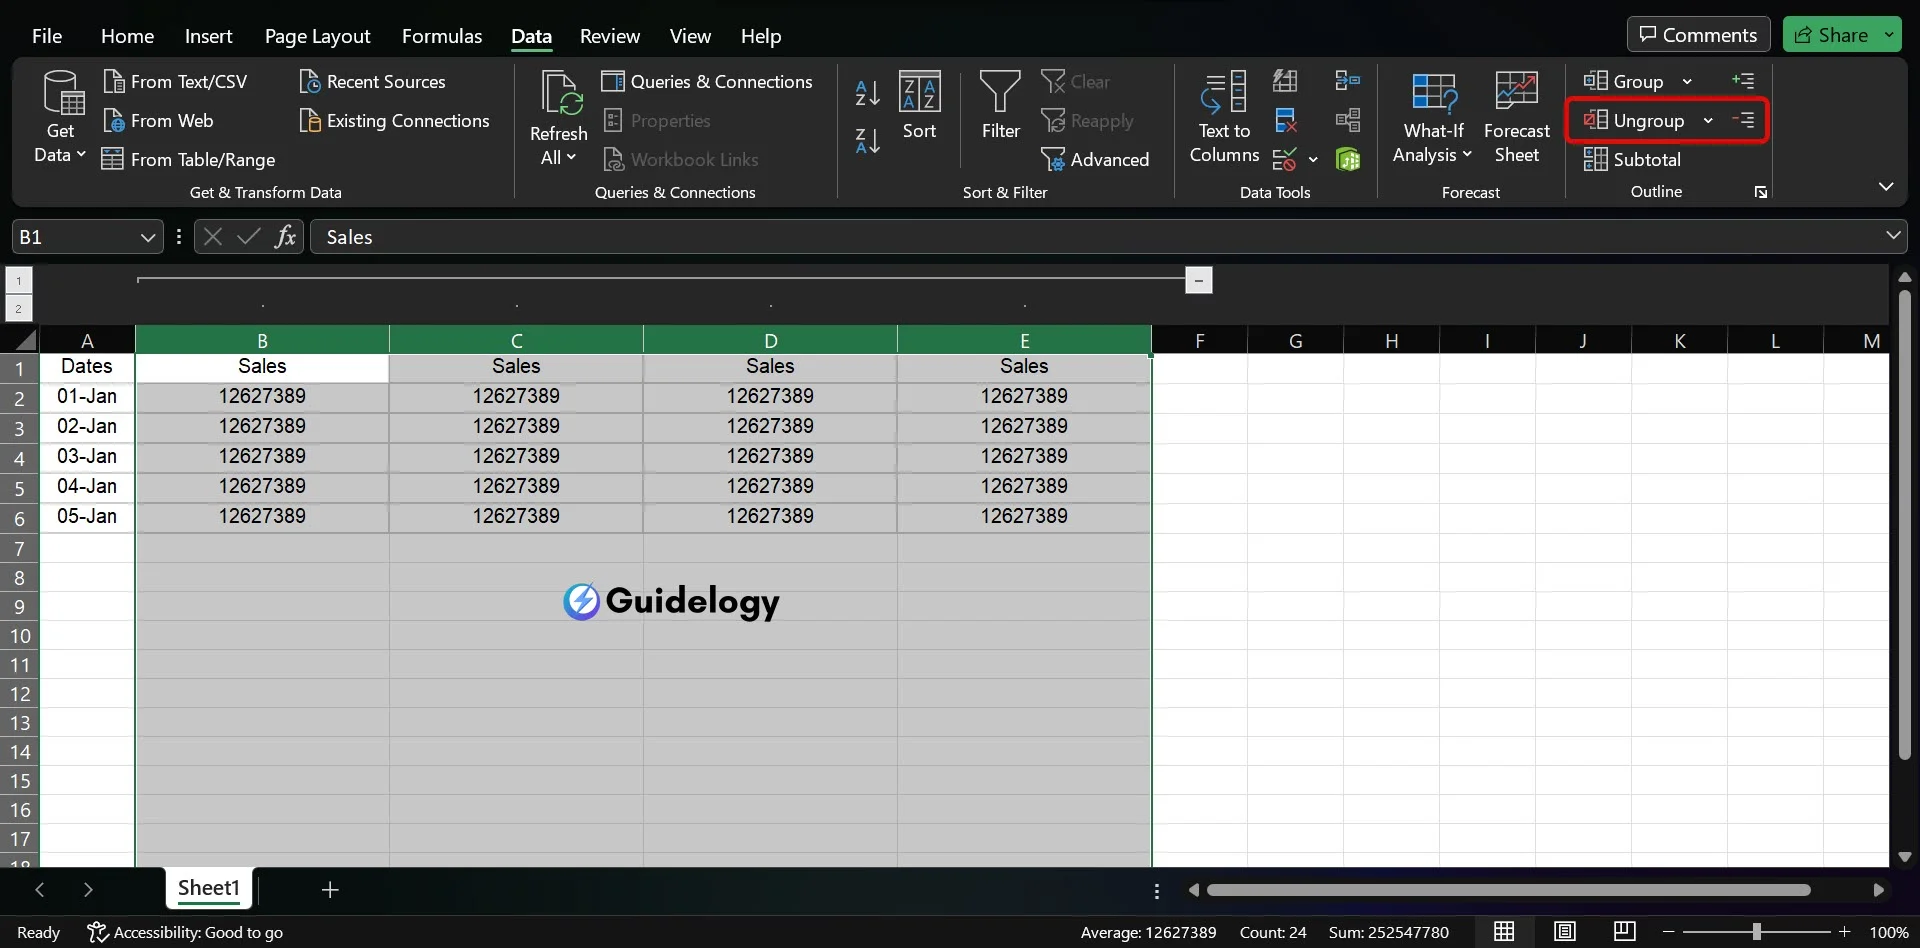
Step 2: Click “Data” & “Ungroup”
Once you have highlighted the correct columns, go to the “Data” tab at the top of the Excel window. Here, you will find various tools for managing data. Look for the “Ungroup” button, which is usually located near other data tools. Once you have selected the necessary columns, simply click on “Ungroup” to start the separation process. It's a straightforward step, but it is crucial for the entire operation.
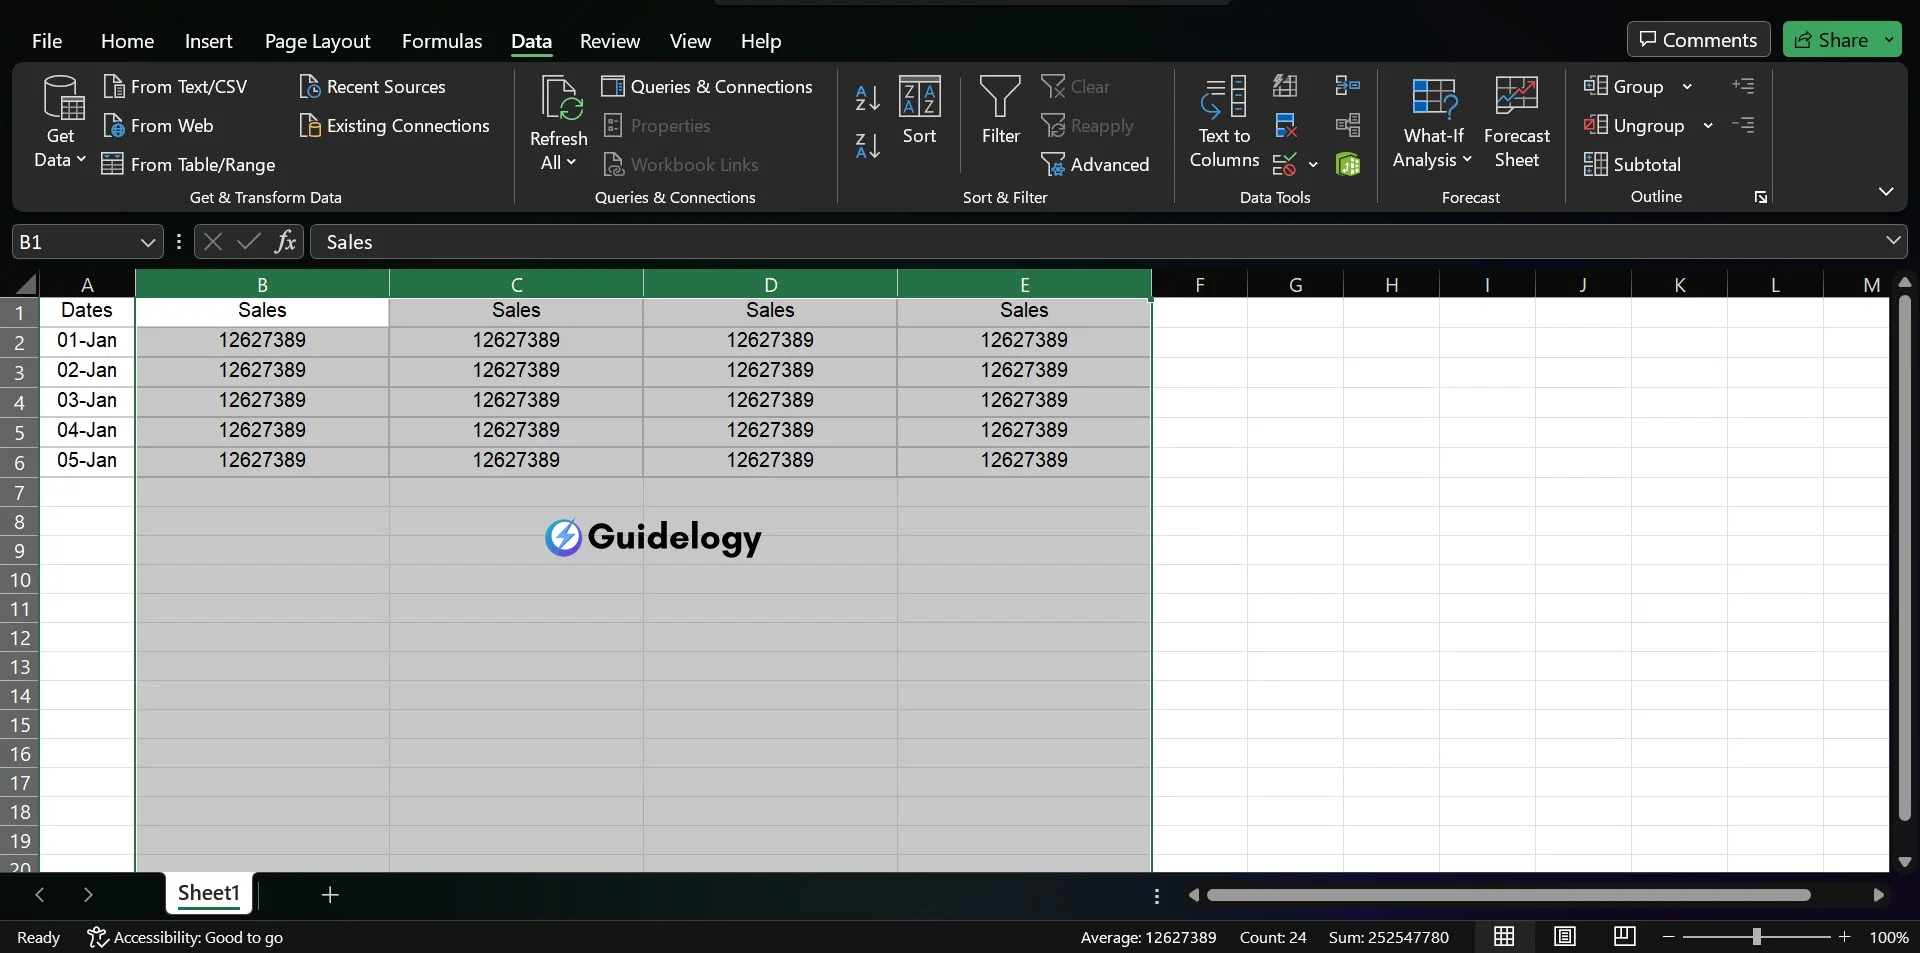
Step 3: It'll be Ungrouped
Once you click the “Ungroup” button in Excel, something magical happens. The columns you selected will no longer be grouped together, and Excel will remove the outlining from those columns, making them separate again, just like they were before. If you have multiple levels of grouping, you might need to repeat the ungrouping process to completely dissolve all nested groups. Your worksheet will then show each column independently, allowing you to view and manipulate your data in a more detailed way.
Tips for Grouping and Ungrouping Columns
Grouping and ungrouping columns in Excel is a powerful feature that enhances spreadsheet organization and analysis. Here are some pro tips on how to efficiently handle these actions.
Also Read: Sheeter AI Review
Grouping by Specific Criteria
When you are dealing with big sets of data, it can be useful to organize the columns based on certain criteria. This helps in keeping your workspace clean and lets you concentrate on the data that is important for you. For example, if you are working on a sales report, you might want to group the columns by different regions or categories of products. This way, you will be able to easily analyze and understand the data.
To do this effectively:
- Ensure your data is sorted or categorized before grouping.
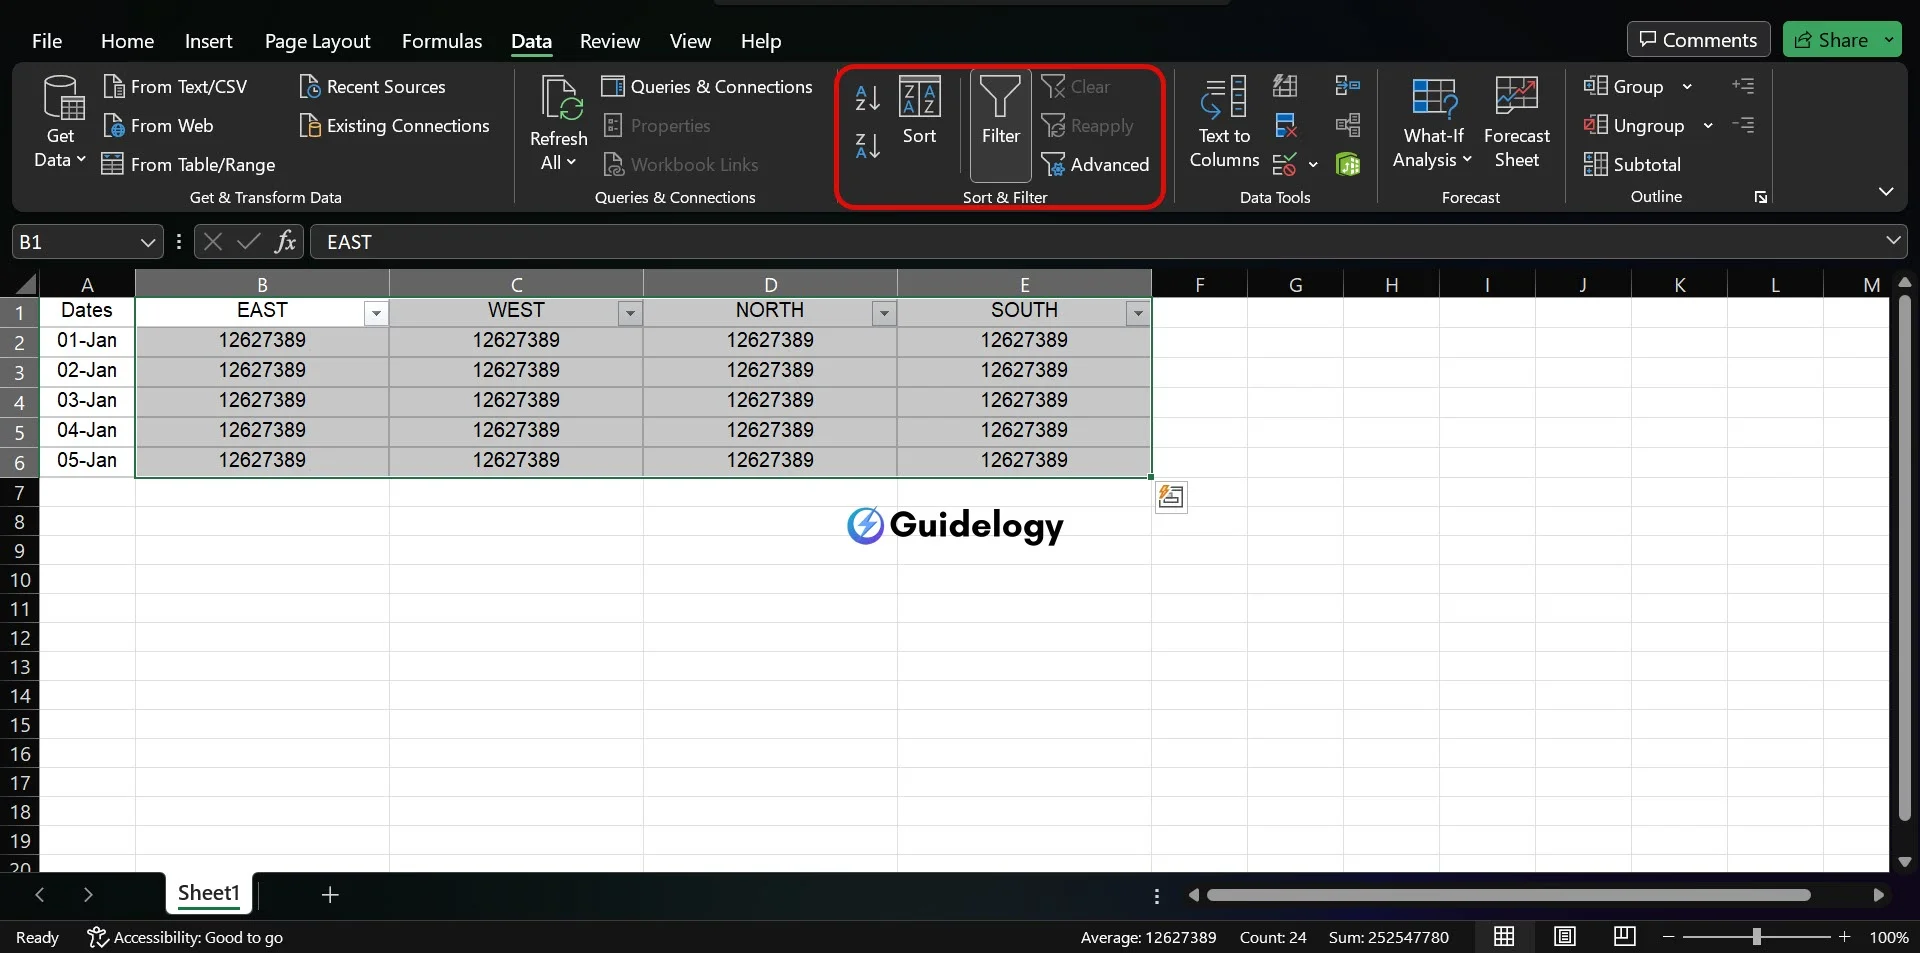
- Use the Sort & Filter feature in Excel to arrange the data.
- Select the columns that meet your criteria and apply the grouping.
When you group your sales data by different regions like East, West, North, and South, it helps you focus on specific trends or comparisons in each area. This makes the insights you gain from analyzing the data much clearer and easier to act upon. In simpler terms, by organizing your sales data this way, you can better understand how each region is performing and make informed decisions accordingly.
Grouping and Ungrouping Multiple Sets of Columns
Sometimes, you might need to put together or separate multiple sets of columns that are not next to each other. This can be a bit challenging, but I can help you with a few steps to make it easier. Imagine you have a financial statement with subtotals for each month of different quarters, and you want to group each quarter separately to study trends in seasons.
To handle multiple sets:
- Hold down the Ctrl key while selecting the columns for each quarter.
- Access the Data tab and click Group, then select the Columns option.
For ungrouping:
- Select the groups you want to ungroup while holding down the Ctrl key.
- Go back to the Data tab and click the Ungroup button.
By grouping and ungrouping in this manner, patterns and cycles that are quarter-specific become easier to spot while maintaining the ability to view data from a yearly perspective when needed. This approach keeps your workbook flexible and responsive to different types of analysis.
Conclusion
Mastering how to group and ungroup columns in Excel can greatly improve the way you manage and analyze your data. Let me guide you through the essentials so that you can easily streamline your workflow. Remember, these steps can make a big difference in your spreadsheets, helping you organize your data better and gain clearer insights. With practice, you'll become an expert at these tasks, making your Excel experience more efficient and your data analysis more powerful. So, go ahead and give it a try! You'll be amazed at how your data transforms into a neatly organized powerhouse of information, thanks to your newfound skills.
Frequently Asked Questions
How do I group columns in Excel?
To group columns in Excel, simply select the columns you want to group, go to the “Data” tab, and click on the “Group” command. From there, choose the “Columns” option, and your selected columns will be grouped together.
Can I group multiple sets of columns at once?
Yes, you can group multiple sets of columns in Excel by selecting the first set, holding the Ctrl key, and then selecting additional sets of columns before grouping.
What are the benefits of grouping columns in Excel?
Grouping columns in Excel helps improve your workflow and makes it easier to analyze data by allowing you to condense and expand data sets for better visibility and organization.
How do I ungroup columns in Excel?
To ungroup columns in Excel, select the grouped columns, go to the “Data” tab, and click on the “Ungroup” command. Choose “Columns” to ungroup and the columns will revert to their original state.
What criteria can be used for grouping columns?
You can group columns in Excel based on specific criteria such as related data types, similar values, or any other logical grouping that aids in your analysis and data organization.
Can grouping columns enhance spreadsheet analysis?
Absolutely, grouping columns organizes your spreadsheet, which can provide clearer insights and more actionable data, thus enhancing the overall analysis.